Use real M&A deal data to build valuation comps
Dealert helps you move from “rule of thumb” to a defendable valuation range built on real transactions – filtered by sector, size, geography, buyer and seller profile.
Designed for investment bankers, PE / VC teams and corporate M&A who need fast, credible comps for pitches, IC and negotiations.
Why building M&A comps is painful without a good database
The hard part is finding enough relevant deals, fast – and keeping your comp set fresh.
Hours of manual digging
Press releases, PDFs, filings and old decks – every new mandate starts with the same Google archaeology just to rebuild a basic comp universe.
Patchy data for small & mid-cap deals
Big terminals are expensive and often skewed to larger deals, while local reports are outdated or one-off. SME transactions fall through the cracks.
Hard to refresh the same comp set
Updating comps for follow-on work means starting from scratch, because the original screening logic lives only in someone’s Excel tab.
How Dealert helps you build valuation comps in minutes
Dealert doesn’t replace your judgement. It gives you a clean, searchable universe of deals so you can focus on interpreting the comps – not hunting them down.
Step 1
Define the peer universe
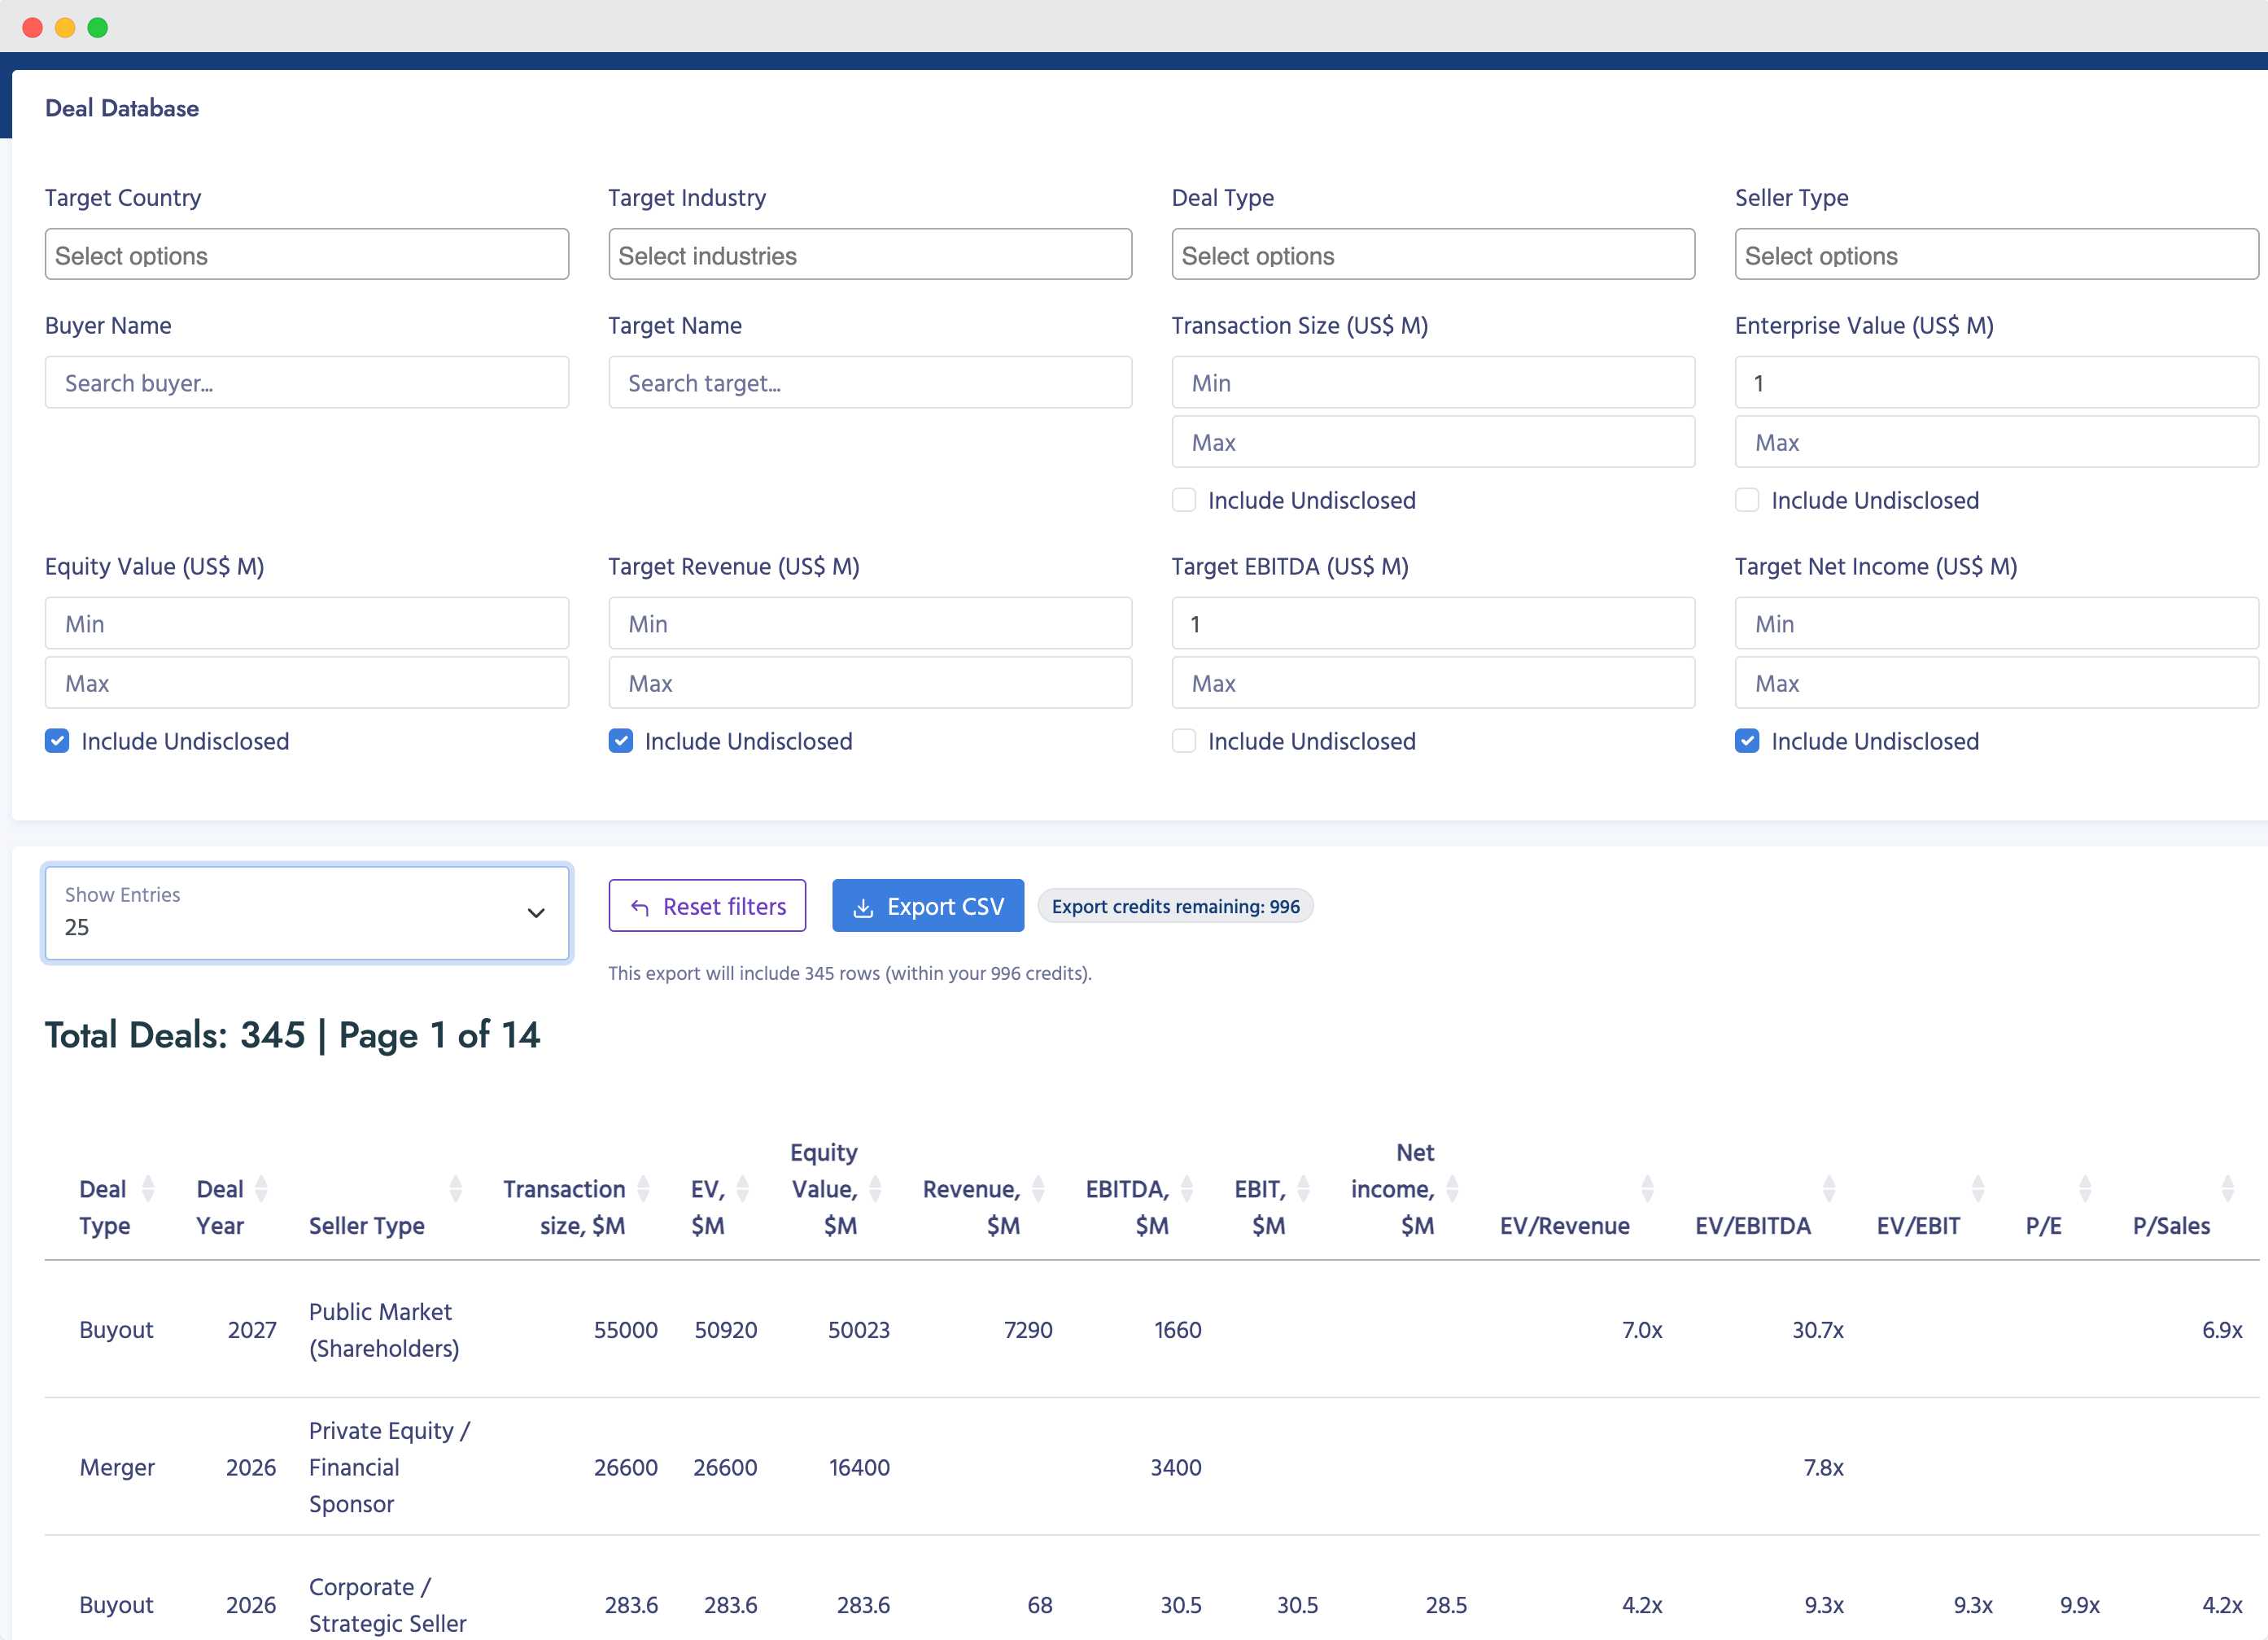
Filter deals by sector, subsector, country, size bucket, deal type and buyer/seller profile to match the asset you are valuing.
Step 2
Review deal details
See who bought what, where and when, with consistent fields that make it easy to include or exclude deals from your comp set.
Step 3
Export to Excel
Export the filtered deals into CSV / Excel and plug them into your existing valuation templates in seconds – no manual retyping from sources.
Step 4
Refresh and defend
Save your filter as a view, rerun it later to refresh comps, and use named deals in decks and IC to back your valuation range.
Slice your comp set the way you actually talk about deals
Dealert’s filters are built around how investment teams think: sector, size, revenue, EBITDA, and other financial metrics, as well as geography, deal type and seller profile – not generic “tags”.
Countries – compare pricing across 180+ markets
Build comp sets focused on your core regions (e.g. DACH, Nordics, North America) or cross-border corridors. See how multiples differ between home and outbound markets.
Helpful for cross-border boutiques and teams who need to justify regional valuation gaps to clients and committees.
Top-3 countries in Dealert
- United States of America 26980
- United Kingdom 7186
- France 4072
Sectors – from broad themes to 963 niches
Start with 13 industries, narrow them down into 61 subsectors, then drill into 895 niches. Build comp sets that reflect your actual investment theme, not just “Tech” vs “Healthcare”.
Ideal for specialists who need to show they know every deal in a specific niche or consolidation wave.
Top-3 industries in Dealert
- Software & IT Services 10442
- Professional & Commercial Services 6176
- Healthcare Providers & Services 5475
Deal types – buyouts vs add-ons vs carve-outs
Separate platform investments from add-ons, growth rounds, majority buyouts, secondaries and carve-outs. Different deal types often sit at different points within your multiple range.
Useful when you need to argue why your asset deserves top or bottom of the sector band given its role in a buyer’s strategy.
Top-3 deal types in Dealert
- Buyout 13163
- Other Private Equity 5522
- Growth Equity & Expansion Capital 5400
Seller profiles – founder, PE-backed or corporate
Filter deals by who is selling: founder / family owners, PE funds, corporates or financial institutions. Seller profile often shapes process dynamics and therefore pricing.
Helpful for teams focusing on succession, sponsor-to-sponsor trades, or corporate portfolio clean-ups.
Top-3 seller profiles
- Family-Owned / Founder(s) / Entrepreneur(s) / Private Individual(s) 48521
- Private Equity / Financial Sponsor 10590
- Public Market (Shareholders) 4259
Illustrative EV / EBITDA deal bands by sector & size
The real value comes from building your own comp sets in Dealert, but here’s a simplified view of how private-market EV / EBITDA deals can cluster by sector and enterprise value.
Ranges are indicative only and shown for explanation. In Dealert you work with named transactions, not synthetic averages.
| Sector (illustrative) | < $25m EV | $25–100m EV | > $100m EV |
|---|---|---|---|
| Vertical software / SaaS | 7.0 – 10.0x | 9.0 – 12.0x | 11.0 – 14.0x |
| Healthcare services | 6.0 – 8.0x | 7.0 – 10.0x | 9.0 – 12.0x |
| Industrial & engineering services | 5.0 – 7.0x | 6.0 – 8.5x | 7.5 – 10.0x |
| B2B business services | 6.0 – 8.0x | 7.0 – 9.5x | 8.5 – 11.0x |
In Dealert, you construct these bands from the bottom up – starting with real transactions that match your mandate, then segmenting by size, geography and deal type.
Example transactions you could turn into a comps set
These are some of the most recent verified M&A transactions in Dealert. In the platform you can filter thousands of similar deals and export them straight into your valuation models.
Latest verified deals in Dealert 69,764 deals available
Access full deal database| Target | Buyer / Investor | Industry | Deal type | Country | Year | |
|---|---|---|---|---|---|---|
| View deal | SACCHARINE | Independent Film Company and Shudder | Media & Publishing | Other | United States of America | 2026 |
| View deal | Crofter’s Organic | Power Sustainable Lios | Food & Drug Retailing | Other Private Equity | Canada | 2026 |
| View deal | DayOne Data Centres | Indonesia Investment Authority (INA) | Other | Other | Indonesia | 2023 |
| View deal | Video Guard | Kooi Camera Surveillance | Other | Other | Other | 2026 |
| View deal | Iron Horse Engineering Company | Polycorp | Other | Merger | United States of America | 2026 |
| View deal | FAR Chemical | Novopor Advanced Science Private Limited | Chemicals | Other | United States of America | 2026 |
| View deal | Lindridge Care Home | Anavo | Healthcare Providers & Services | Venture Debt | United Kingdom | 2024 |
| View deal | Eolas Medical | Acton Capital | Healthcare Providers & Services | Series A | United States of America | 2023 |
| View deal | Natural Innovations | Solina | Food & Drug Retailing | Other | United Kingdom | 2023 |
| View deal | Chindata | Shenzhen Dongyangguang Industry Co., Ltd. | Telecommunications Services | Buyout | China | 2026 |
Showing 1 to 10 of 69,764 transactions you can use as starting points for valuation comps in Dealert.